GBPAUD | Double Bottom Pattern | Real-Time Example
Posted by Klejdi Cuni on
GBPAUD | Double Bottom Pattern | Real-Time Example
How Can You Trade It?
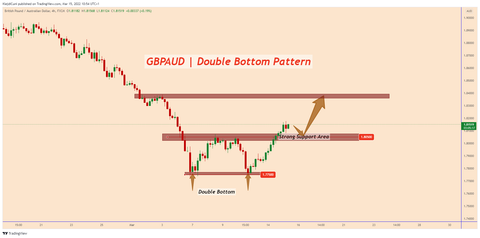
As many of you may know, the Double Bottom pattern is created when the price is getting ready to change direction
of price movement.
1-) In our example, GBPAUD made the first move down close to 1.7750
2-) After that, the downward movement was followed by a strong pullback up to 1.8050
3-) In the next step, the price moved down again close to 1.7750 by creating in this way the potential second leg of the pattern.
4-) The price increases the bullish momentum and manage to rise again.
5-) At this moment we set a horizontal trend line at 1.8050 that corresponds to the top of the structure.
This will be the pattern's neckline.
Targets:
We measure the distance from the bottom up to the neckline of the pattern.
The movement measured from the bottom to the neckline of the model is added to the price after it breaks out from the neckline.
This will give us the expected target from the price movement.
How Can You Trade It?
As many of you may know, the Double Bottom pattern is created when the price is getting ready to change direction
of price movement.
1-) In our example, GBPAUD made the first move down close to 1.7750
2-) After that, the downward movement was followed by a strong pullback up to 1.8050
3-) In the next step, the price moved down again close to 1.7750 by creating in this way the potential second leg of the pattern.
4-) The price increases the bullish momentum and manage to rise again.
5-) At this moment we set a horizontal trend line at 1.8050 that corresponds to the top of the structure.
This will be the pattern's neckline.
Targets:
We measure the distance from the bottom up to the neckline of the pattern.
The movement measured from the bottom to the neckline of the model is added to the price after it breaks out from the neckline.
This will give us the expected target from the price movement.